
The LinkedIn score you should not trust at face value
You have probably seen a variant of this post:
“Hey LinkedIn - I just shipped a new AI pentesting tool. It scores 100% on OWASP Juice Shop. Try it!”
Juice Shop and similar intentionally vulnerable training apps are useful for manual offensive learning: they are public, stable, and well labeled. They are also nothing like what most organizations need to defend, and are too well-documented on the internet
A perfect score on Juice Shop mostly proves fit for Juice Shop, rather than a tool that will discover your real surface, turn noise into actionable leads, produce viable proof of exploitability, and gather all that in one platform.
That gap is why we stopped trusting vanity benchmarks and ran our own study on a private, undocumented application complex enough to represent a real-world application with a fixed set of reference vulnerabilities.
What we set out to test
Our goal was to stress-test two serious approaches to autonomous offensive AI:
- Our enterprise-focused solution, Terra Platform™.
- The most popular CLI open-source tools claim to achieve the same thing.
The way we determined success here was not by the “longest list of findings,” but by whether the system behaves the way buyers and operators need it to: easy onboarding, discovery, vector quality, exploit alignment with the known truth set, reproducible proof, and operational fit.
Scoring criteria (seven axes) - and why each one matters
- Ease of Use - Can a team run it repeatably, not only a single expert on a good day?
- Application Understanding - Does the tool understand the app's actual architecture and business goal (e.g., who owns auth vs. payments vs. API)? Wrong pain points understanding = wrong business-related tests.
- Recon / Asset Discovery - Can it map the surface you will actually defend? Wrong discovery = partial attack surface coverage.
- Vectors / Lead Generation - Does it produce prioritized, triage-friendly leads or only titles of known attack categories?
- Exploitability - How many exactly match the golden vulnerabilities vs. partial overlap vs. extras (often false-positive)?
- Reproduction & Proof - For accepted claims, what share of evidence is strong vs. qualified vs. weak? Can a person looking at the findings report reproduce them themselves?
- Reporting - Is the output in an understandable reporting format or just a JSON with titles?
We are not publishing a single “winner” for social proof. We are asking: If this were your bank’s stack, would you bet a program on these behaviors?
Results by criterion
Perquisites
We scored the most popular tools, but for the sake of this report, we’ll focus on the top four. The measurements are the average score/behavior after a few iterations.
Criteria 1: Ease of use
Each tool got the same resources:
- Application domain (with the subdomains, when supported)
- The repository, as a local folder
- Bedrock access for models
How did they handle it?
Some tools’ onboarding experience was as easy as a single command, with all the paths and the bedrock key as an environment variable. Others needed the config file.
We needed to dig into the code and documentation to understand what was missing and why it was failing, which resulted in wasted tokens on nothing.
The most painful point of contact was that our test subject was an app with subdomains, each with different functionality, and most tools (all but one) didn’t support this type of test at all.
The solution was to run a test on each subdomain as a standalone app and merge the results. With that, we lost the option to test cross-functionality vulnerabilities and chaining of vulnerabilities for a full attack.
However, in Terra Platform, onboarding requires the app URL in the preferred format. The option to integrate code as a remote repo is supported, and the models are opted for each component in our solution.
Criteria 2: Application understanding
Criteria 3: Recon / asset discovery
As we know, the first step in any successful assessment of an app is Discovery, and as expected from a solution, the granular view of “what you tested” in terms of “where did the tool reach” is as important for visibility into the process, and mapping touch points
Unfortunately, none of the tools place emphasis on this part, even in interactive ones. When we asked the agent about assets or specifically “where it went for testing,” we did not get a clear answer.
After digging through the traces and testing reports, we could see glimpses of which pages the agents encountered, but not the asset object type.
At Terra, to give the customer visibility into what’s being tested and where, and as a way to give the customer the free will to focus on parts they want tested more, we point an attack to an endpoint.
For example, the /payments endpoint might be more important to a customer than the /news endpoint, so they can focus on tests involving /payments.
So no numbers for this criterion, as none of the tools gave the option to compare them in this criterion.
Criteria 4: Vectors / lead generation
We measured how work was parallelized (queued or spawned “attempt” tracks), then how categories split within each run. Below shows the share of each platform runs its own attempt pool (sums up to 100% per run):
Share of each platform runs its own attempt pool (sums to 100% per run):
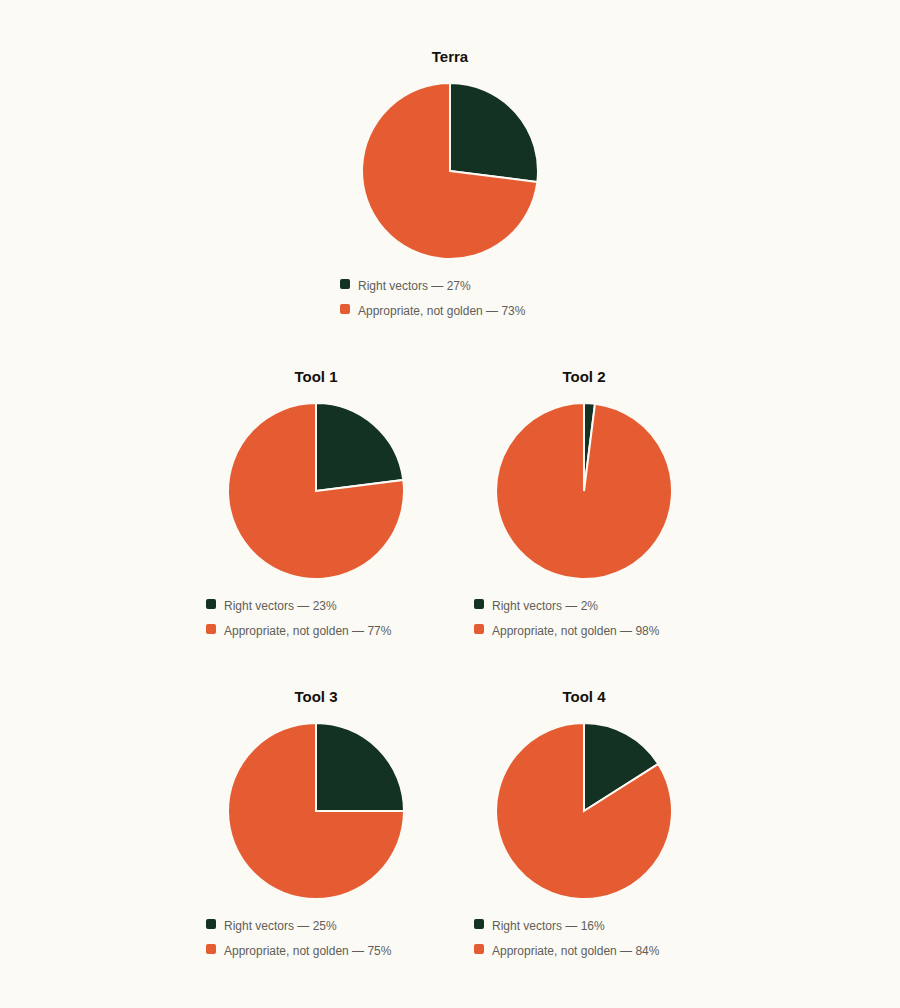
When we talk about leads, we know it can be noisy. However, a tool can be noisy yet provide full coverage, while other tools can be less “spammy” yet miss true vulnerabilities.
Most tools were heavy on parallel exploitation attempts. None exposed a first-class “lead” object (deduplicated, prioritized, human-approved if needed).
Criteria 5: Exploitability vs. golden
We classify each bucket as exact (matches golden intent), partial (related but not the same issue), or extra (outside / noisy relative to golden grading).
Exact match rate = amount of exact hits ÷ amount of golden truths:
Terra - 84%
Tool 1 - 62%
Tool 2 - 54%
Tool 3 - 46%
Tool 4 - 8%
Partial match rate = amount of partial hits ÷ amount of golden truths:
Terra - 15%
Tool 1 - 8%
Tool 2 - 8%
Tool 3 - 16%
Tool 4 - 0%
Takeaway: the Tools’ runs sat at roughly mid‑50% to low‑60% exact on the golden set, not “100% on Juice Shop” numbers. One CLI run landed near half exact on the same yardstick, while another collapsed to single-digit exact while pushing a large share of extras. This kind of variance makes headline scores misleading.
Criteria 6: Reproduction & proof (among accepted claims only)
Denominator = claims we accepted as correct for that run (not every log line).
While we present average scores for the criteria, some tools were somewhat inconsistent in their assessments of the same vulnerabilities. There were times when the vulnerability was fully analyzed in the repo code, and other times it was fully tested with a POC. That is run-to-run variance in a nutshell: not what you want when a program promises predictable evidence quality.
Criteria 7: Reporting
From a reporting standpoint, as we mentioned already, all the tools are heavily vulnerability-oriented and output-focused. Most of the “final reports” we’re conducting from “you have x critical vulnerabilities: list of vulnerabilities,” and that’s basically it. No actual form of report like a pentesting service…
To find POC’s and reproduce steps, we had to dig into the logs to see executions, and some tools provided a deep-dive file into each vulnerability detected. That was helpful; however, it should be included in the final report.
What we learned: platform vs. tool
A tool (especially a good open-source one) gives you an engine: models, prompts, scripts, sometimes impressive parallelism and speed. It focuses on output and acts more like a black box, where, at the end, you get a list of vulnerabilities the agent thinks you’re vulnerable to.
A platform, such as Terra Platform, gives you an operating model and a place to manage your risk, from an asset discovery standpoint to the full reports presenting a test on an app, visibility into your app, and the test process (what was tested, where it was tested, what the attempts were, and what they produced). And of course, a list of all the confirmed vulnerabilities you’re vulnerable to.
Why open-source-style tools are genuinely good, however, not as an enterprise solution
Open-source-style tools are valuable because they advance the field and democratize experimentation. They make it easy for researchers to try ideas quickly. They often ship transparent behavior that researchers can inspect and extend. And they find a big percentage of vulnerabilities in a tested environment.
However, they are not sufficient as a full enterprise solution because enterprises must place a heavy emphasis on the attack platform and coverage. Enterprises need stabilized outcomes across runs, people, and quarters, not to celebrate one lucky seed. Claims must also be proved, with scope and audit trails bounded for regulators or compliance organizations, not only to the author’s Twitter thread. Architectural differences, where components are fine-tuned to their best-fit model of choice rather than “one model to rule them all,” are also critical.
In Summary
Juice Shop–style “100%” stories are bad predictors for multi-service, authenticated, business-logic-heavy systems, a.k.a. the real-world apps.
Percent view: Terra runs held 84% exact-on-golden, with proof skewed toward strong/qualified, CLI tools runs showed ~8–46% exact, with a high share of extras on the noisiest run and volatile proof on small accepted sets.
Platform vs. tool is the real axis: tools win on quickness, and small “dumb” apps focus. Platforms win on programs (discovery → leads → exploitation, plus governance and evidence).
Open-source agents deserve credit, but enterprises need something that turns their output into defensible, repeatable, integrated operations.
Visit Terra Security’s research to learn more.